Factory Analytics Transparency
- Source
- factory.com
- Author
- Factory News
- Date
Context
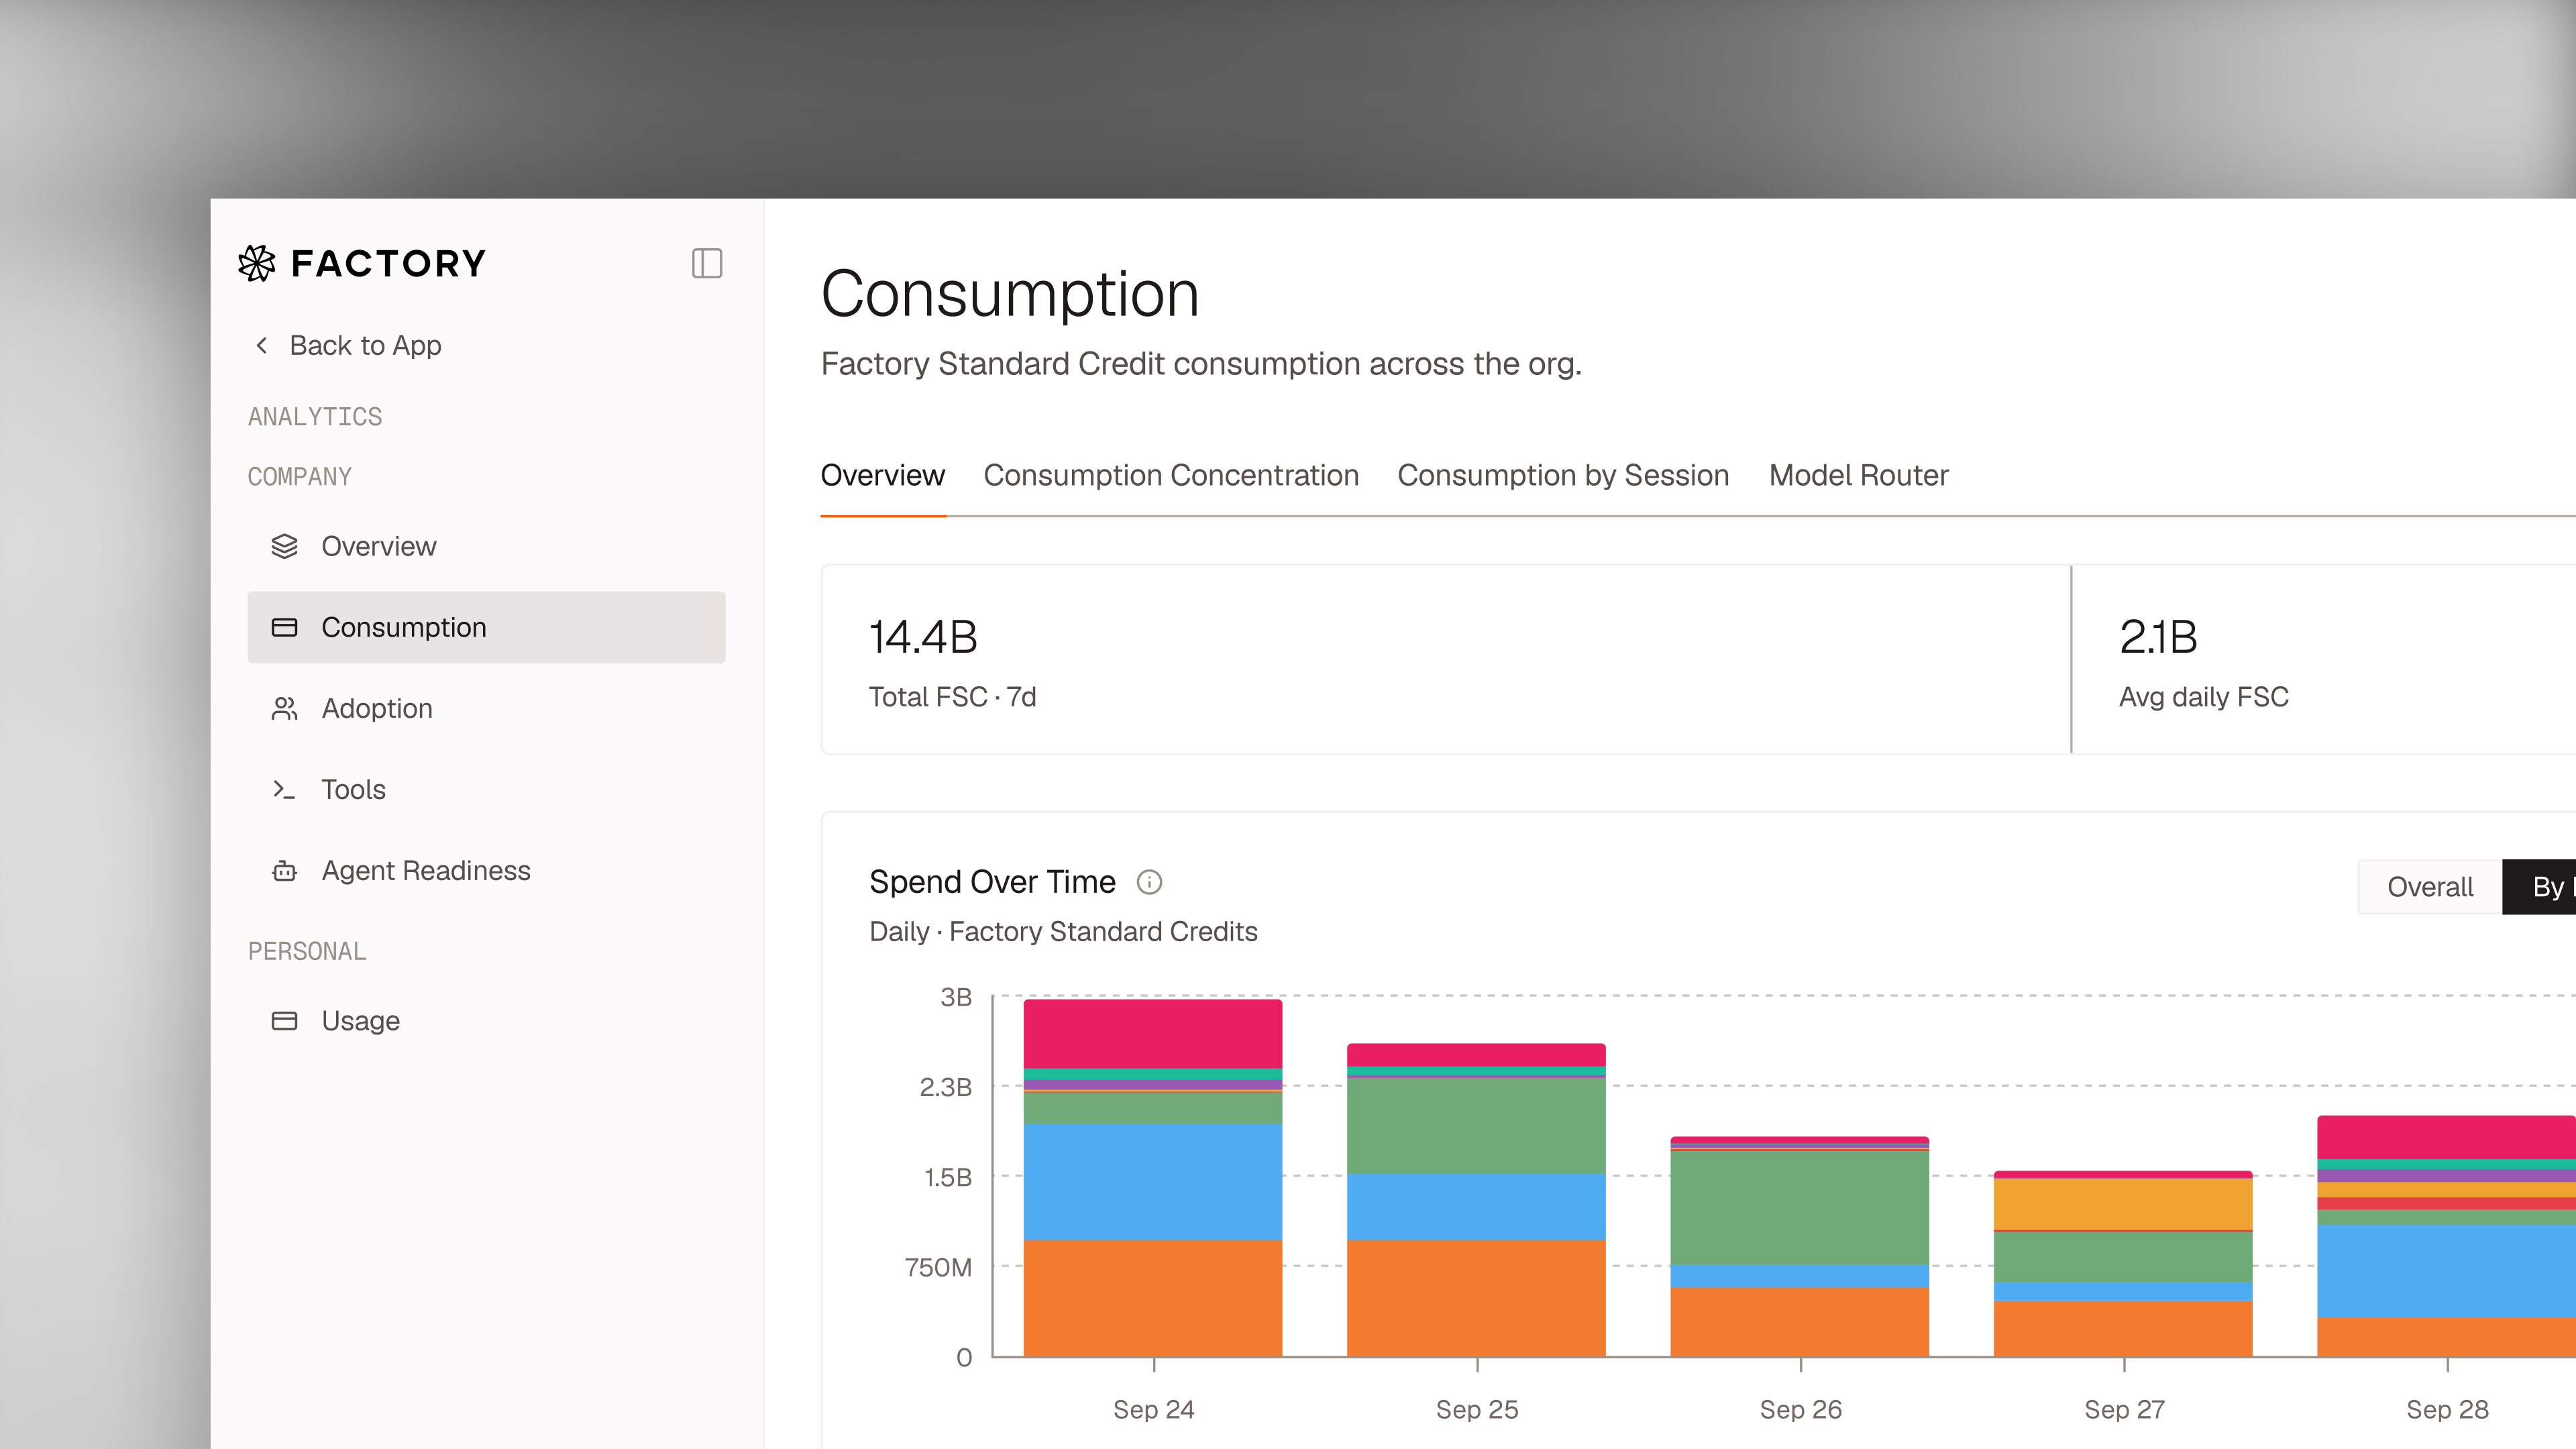
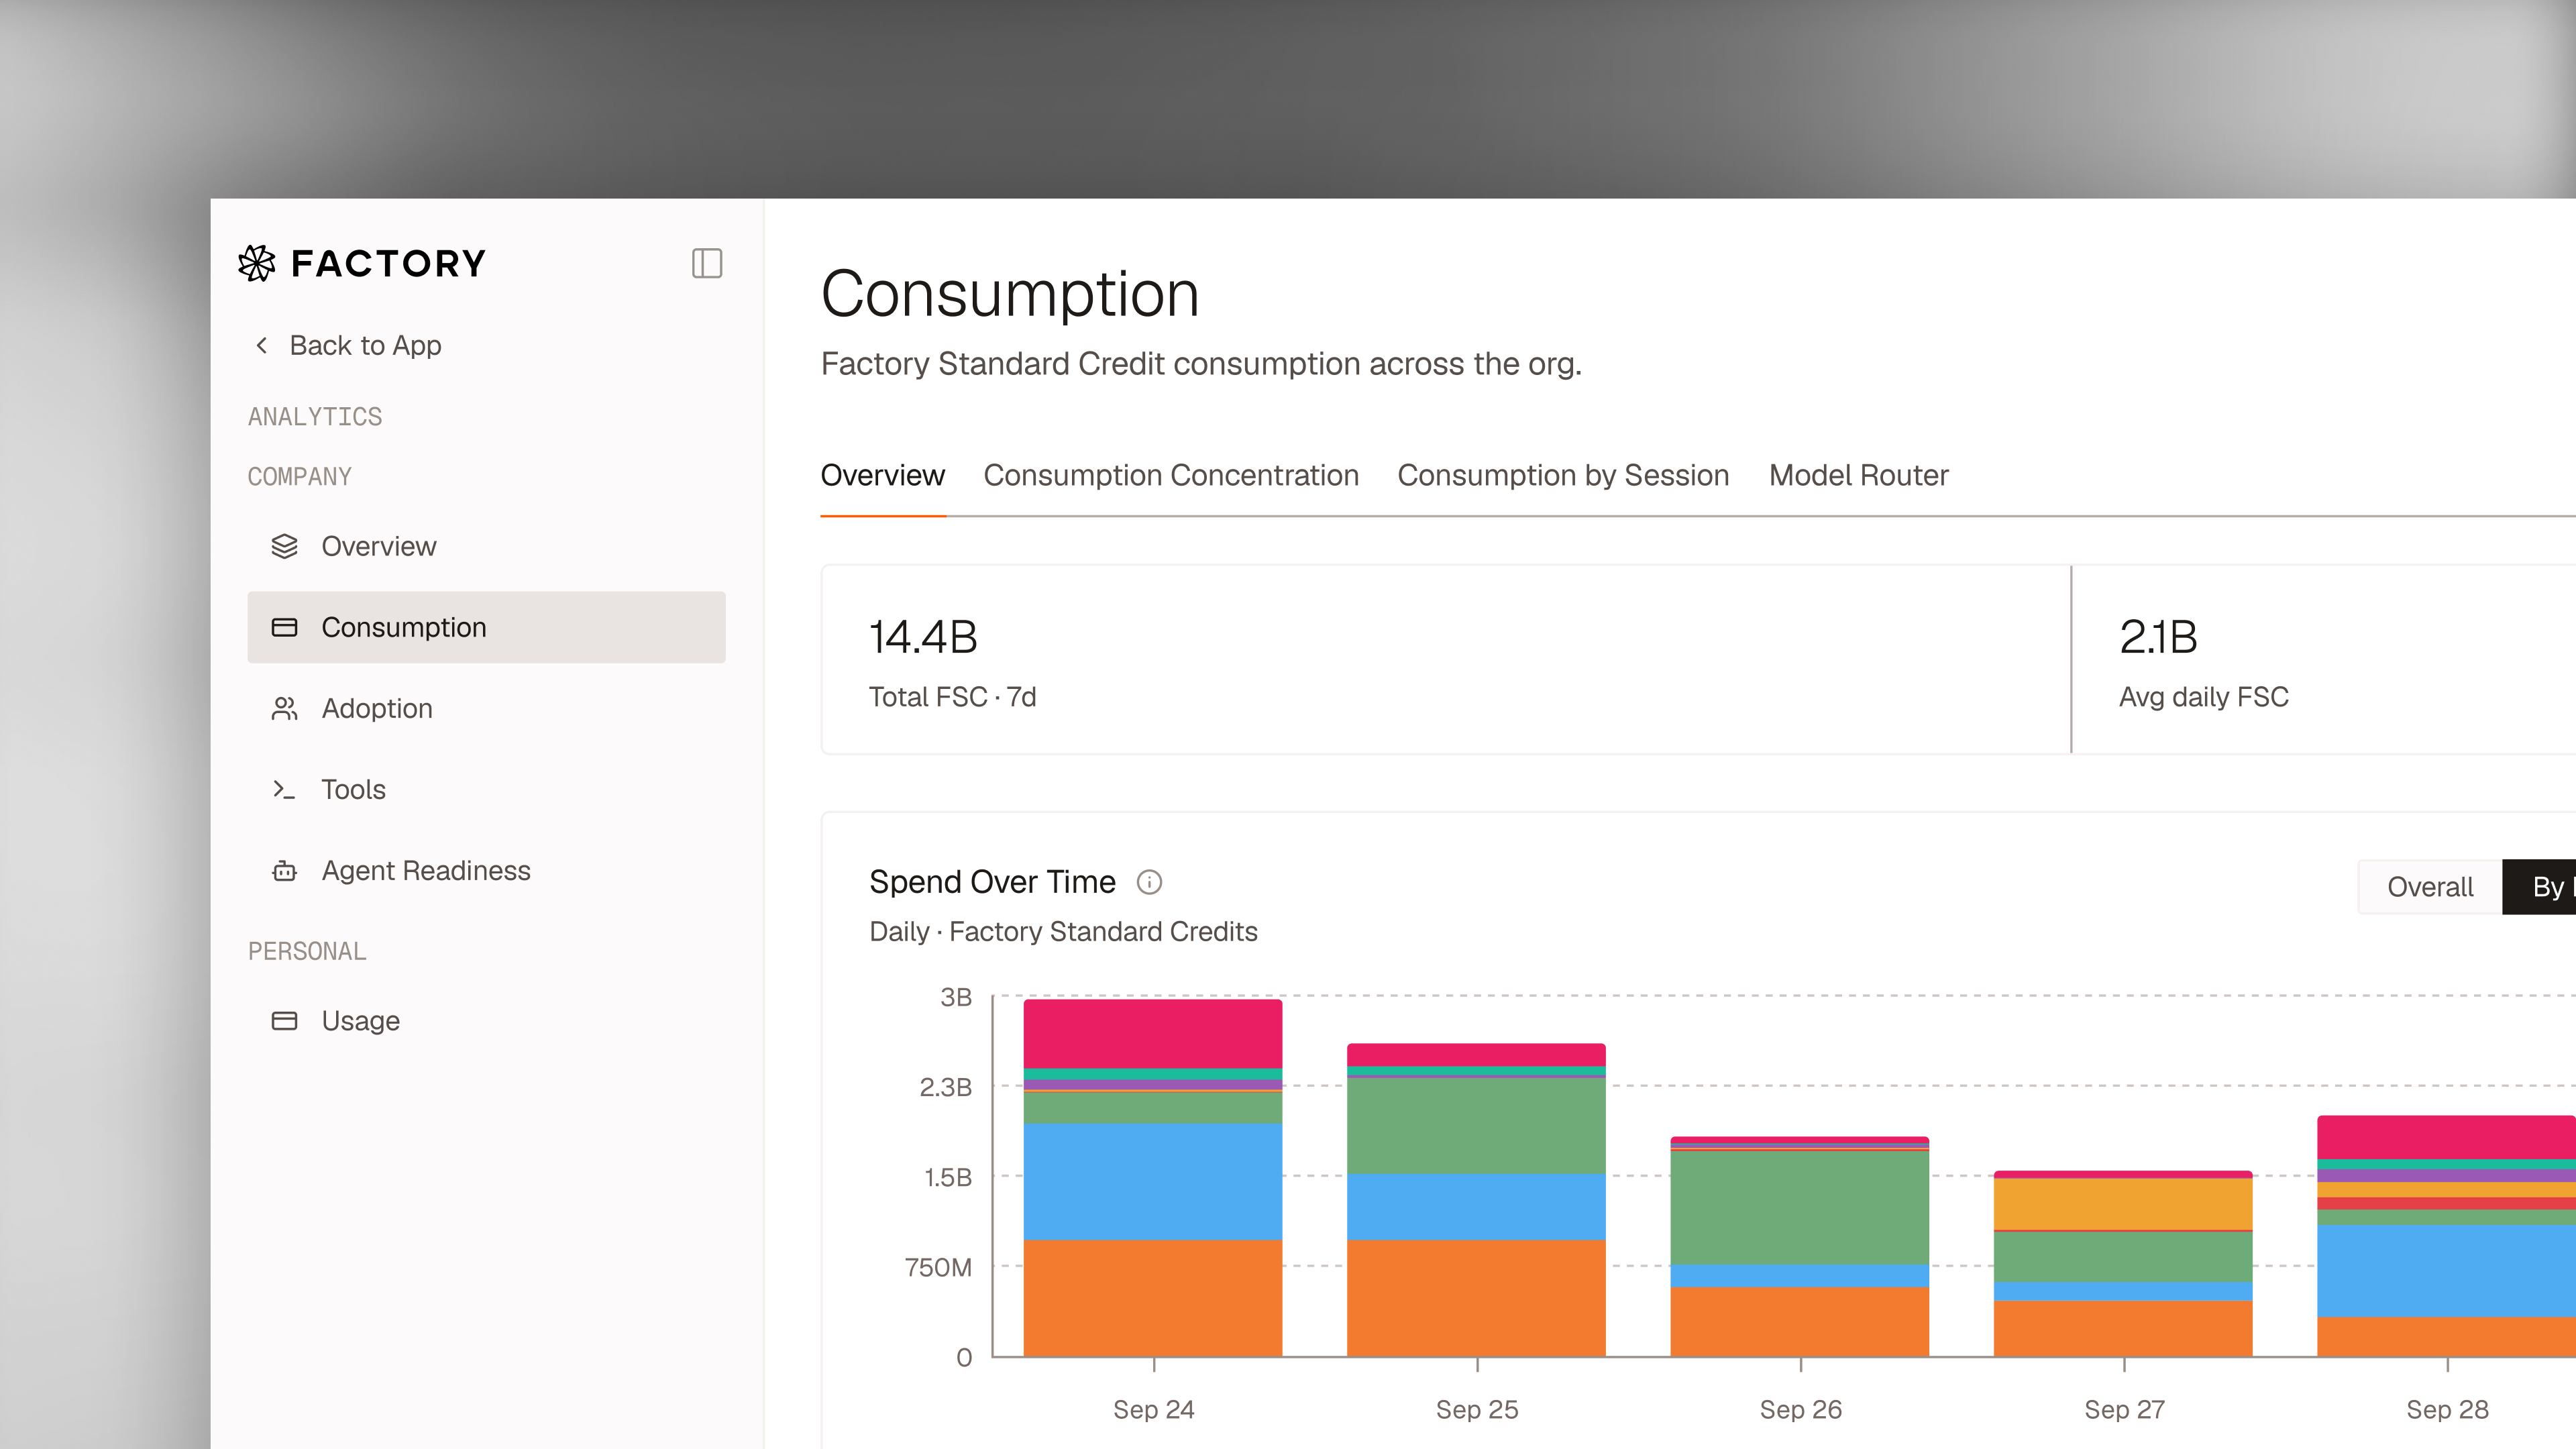
Factory's redesigned Analytics reports how much its coding agents consume and who is using them. The Consumption view shows credits over time, by model, and by user, so when consumption spikes a team can see which model or user accounts for it. A separate Cost Concentration chart plots cumulative consumption across the organization; Factory says a smaller group of power users and automations accounts for most consumption in most deployments, and leaders can check that against the teams they expect.
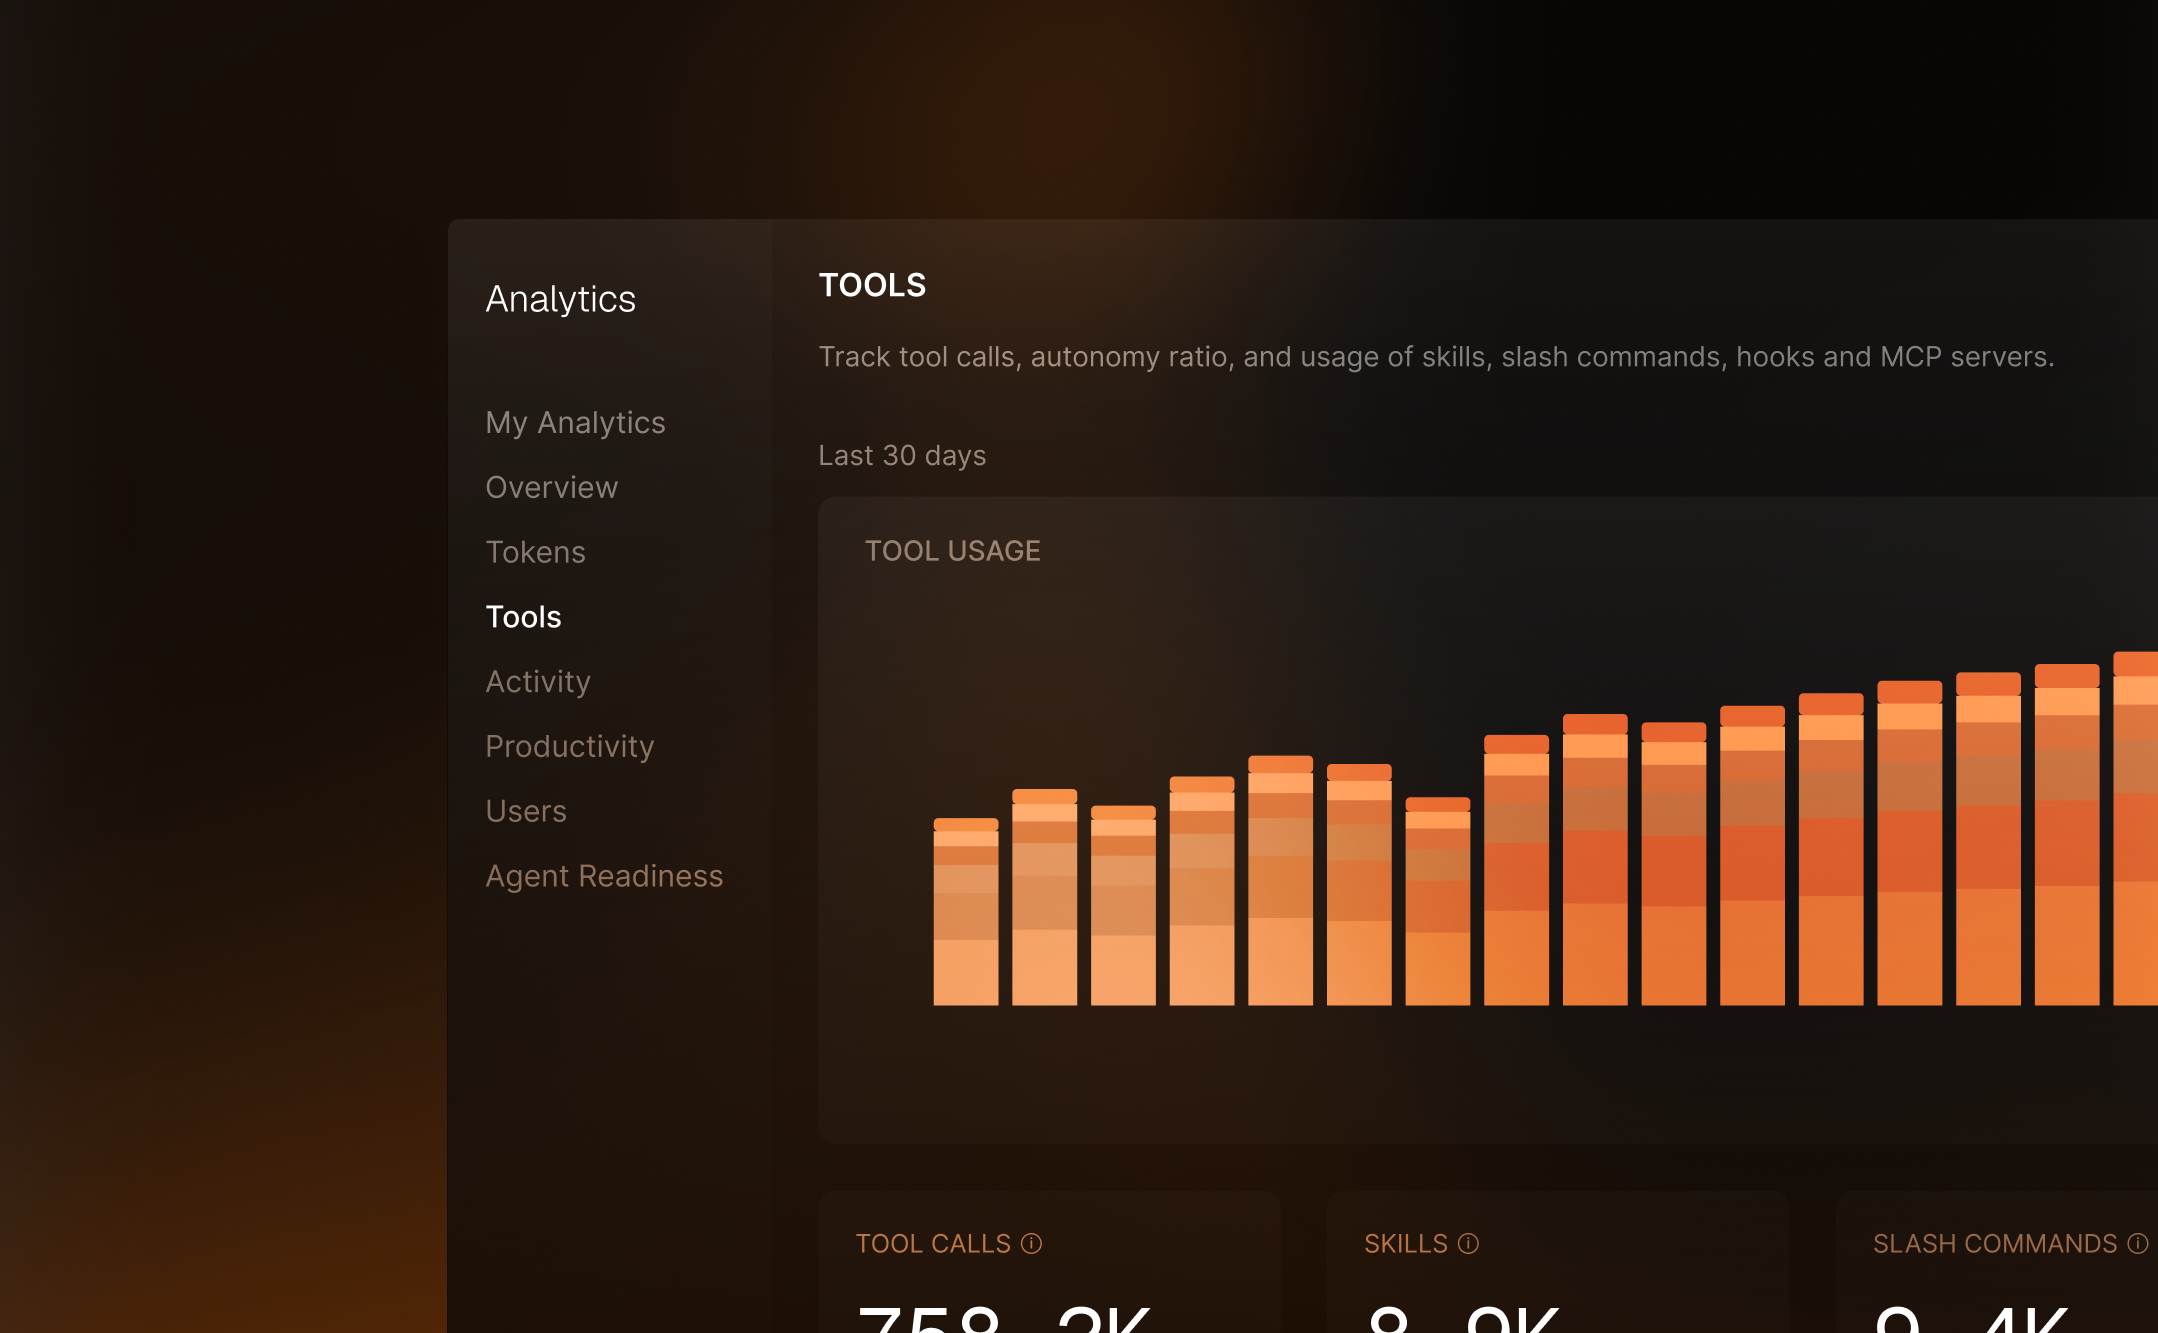
The Adoption view reports daily and monthly active users and sessions, so budget owners can read consumption alongside participation. Metric tooltips define each calculation, and enterprise organizations can pull usage by model and user through an API. These views describe allocation and adoption; they do not measure the quality of the software produced.

Checking sign-in…
Loading comments…