StatLite
pvrlabs.xyz- Category
- Developer Tools
- Rank
- No. 1190Tools index
- Type
- TOOL
- Use case
- Deployment & Operations
- GitHub
- 240 stars
- Latest release
- v0.7.3
- Date
About
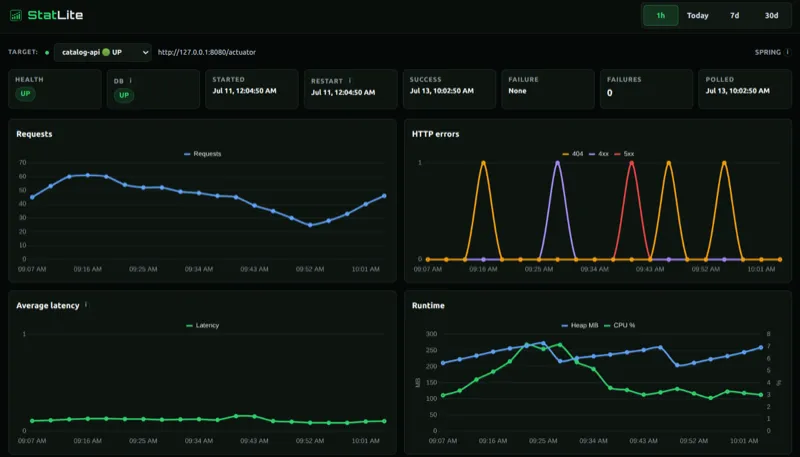
StatLite is a self-hosted monitoring dashboard distributed as a single Go binary that idles at about 15 MiB. It stores history in local SQLite and charts health, traffic, latency, CPU, and memory for Spring Boot Actuator, Quarkus, Micronaut, and apps using its JSON metrics profile, without needing Prometheus or Grafana. It has no built-in authentication and is meant for private networks.
What it does
A small monitoring server you run next to your own apps. Every 30 seconds by default it asks each app for its numbers (request counts, errors, response time, processor and memory use), saves each reading to a single file on disk, and draws charts of that history in a browser page. Java apps built on Spring Boot, Quarkus or Micronaut work with no code changes. Apps in Python, Node or Go add one small JSON endpoint from a copyable guide. A setup command probes a running app and writes the starter config for you.
Why it's ranked here
It solves a narrow problem precisely. MIT licensed, one Go program, and only four direct dependencies, including a pure-Go SQLite driver, so there is no C toolchain or external database to run. The authors publish a measured footprint of roughly 10 to 15 MiB idle and a reproducible test beside a Spring Boot app on a 512 MB machine. The documentation is unusually honest about limits: missing readings stay missing rather than becoming zero, and the external API states exactly which fields can mislead. The audience is small by design, so this is a sharp niche tool, not a general observability platform.
What's good
Careful about what it does not know. A failed poll records no fake values, counter resets break the delta instead of producing a spike, and processor charts refuse to mix units from different sources. Responses from monitored apps are capped at 1 MiB, so a misbehaving endpoint cannot flood it. The read-only external API rejects unknown parameters and returns an error rather than silently truncating an hour of data. Retention defaults to 90 days and pruning runs on startup and daily. Install paths cover a shell script, Homebrew, and Docker images for x86 and ARM Linux.
Tradeoffs
There is no login of any kind on the dashboard or the API. The program prints a warning when bound beyond localhost, but protection is your job: firewall, VPN, SSH tunnel or an authenticated proxy. The metric set is fixed. It reads a short list of request, memory, processor and disk readings and ignores everything else a Prometheus endpoint exposes, with no logs, tracing or alert delivery. Each install is one server watching a few apps, not a fleet. Timestamps are stored as text, and the storage notes admit rare ordering edge cases where old and new formats share a second.
How to use it well
Best fit: one or a few apps on a small VPS or home server where Prometheus plus Grafana would cost more memory than the app itself. Keep it bound to localhost and reach the dashboard through an SSH tunnel. Leave the self-monitoring target on so host memory, processor and disk show up beside your app. Use the setup command to generate the first config, then keep target names stable, because history is keyed to them. Script checks against the versioned API and own your thresholds there. Look elsewhere if you need custom metrics, alerting, logs or many hosts.
Technical notes+
cmd/statlite/main.go dispatches between the inspect subcommand and the monitor loop; the monitor opens SQLite, registers targets, binds the listener before starting poll goroutines so the self-target can scrape its own /statlite/metrics on the first poll, and warns when config.IsLoopbackListen is false. internal/app/bootstrap.go maps target types (spring, quarkus, micronaut, caddy, statlite-metrics) to collectors; Spring defaults to metrics_source auto and builds a Prometheus client beside the Actuator client. internal/collector/actuator.go caps bodies at actuatorMaxResponseBytes (1 << 20) via io.LimitReader and classifies failures into authentication, not_found, http, malformed_json, transport and response. internal/server/server.go registers the dashboard, internal /api/* routes, the supported /api/v1/status, /api/v1/events, /api/v1/metrics, and unauthenticated /debug/poll-now, with 10s read/write timeouts. docs/storage.md records PRAGMA user_version schema 2 and no general migration framework. docs/api.md caps the hourly read at 4,096 polls. go.mod pins modernc.org/sqlite, yaml.v3, purego and x/sys.
Observed
- License
- MIT
- Language
- Go, single binary
- Storage
- Local SQLite via a pure-Go driver, schema versioned with PRAGMA user_version
- Install surface
- Shell installer, Homebrew tap, Docker images for linux/amd64 and linux/arm64
- Interfaces
- CLI with inspect subcommand, web dashboard, read-only HTTP API v1
- Supported sources
- Spring Boot Actuator, Quarkus and Micronaut Micrometer, Caddy metrics, StatLite Metrics v1 JSON
- Authentication
- None built in for dashboard or API; README and startup warning say so
- Default retention
- 90 days, configurable, 0 disables pruning
- Response size cap
- 1 MiB per Actuator response
Read from README.md, go.mod, LICENSE, cmd/statlite/main.go, internal/server/server.go, internal/app/bootstrap.go, internal/collector/actuator.go, internal/collector/doc.go, docs/storage.md, docs/metrics.md, docs/api.md, docs/configuration.md, statlite.yaml, docs/low-resource-monitoring.md.
Tags
Tech Stack
Media
Comments (0)
No comments yet
Editorially curated, with community endorsements as a secondary signal. Corrections welcome.