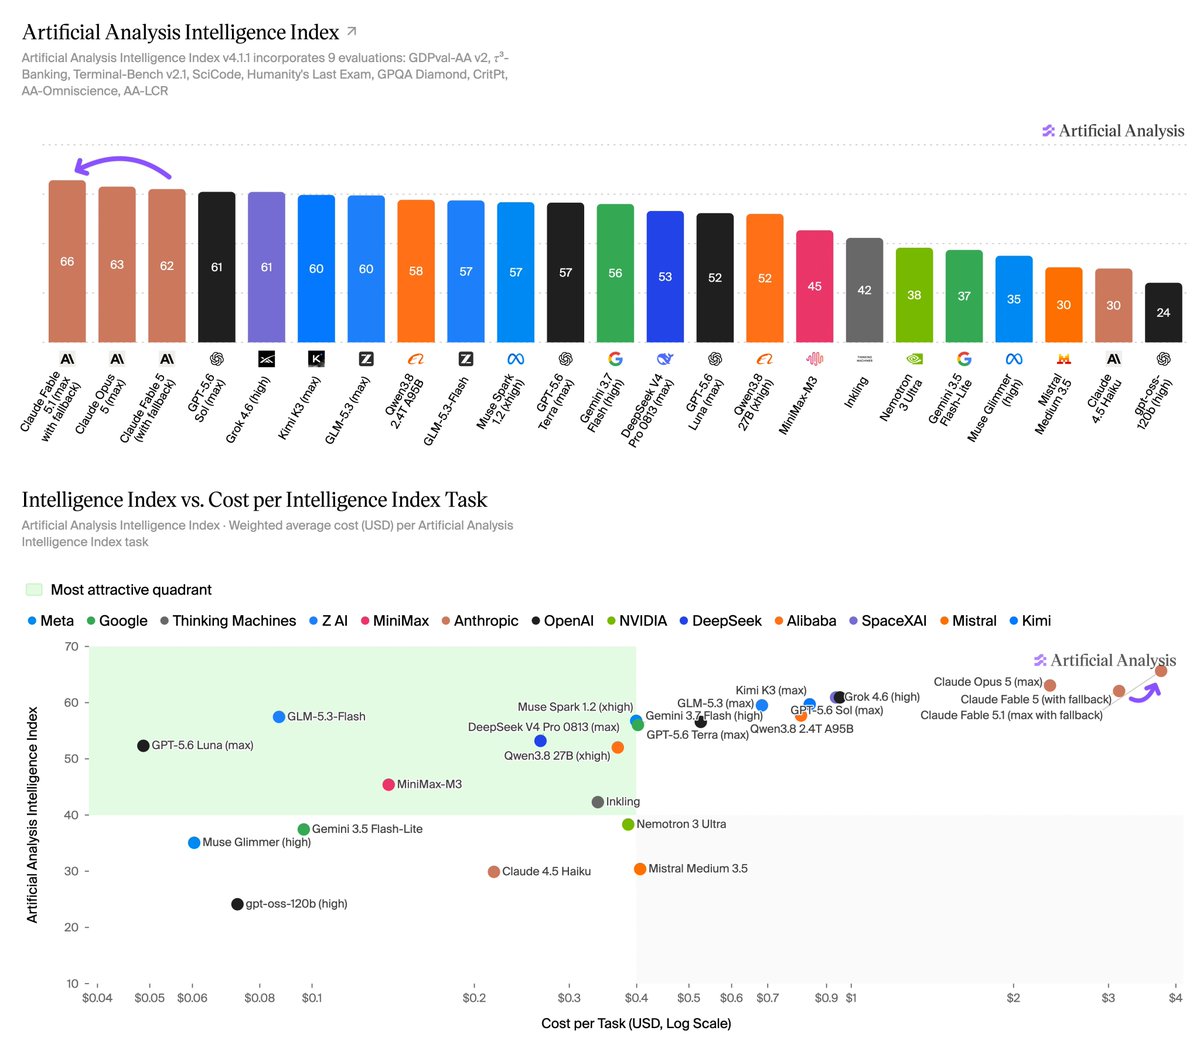
On the Chartography benchmark (100 questions over dense real-world charts), Fabl
Source
x.com
Author
ClaudeDevs
Date
Context
Giving a model a closer view can improve chart reading without changing the model itself. Anthropicreports that adding a zoom tool raised Fable 5's accuracy from 29% to 73% and Sonnet 5's from 13% to 44% on Chartography's 100 questions about dense charts.
The cookbook implementation lets the model request a region, crops it from the full-resolution original, and returns an enlarged view. Small labels or closely spaced lines can then occupy more of the image the model processes. These are vendor measurements of a model-plus-tool workflow, graded with a model judge. Extra zoom calls also resend history and image content, increasing usage.
Terms in this piece · Glossary
benchmark — A standard public test set for comparing AI models — the shared scoreboards behind every "model X beats model Y" claim.