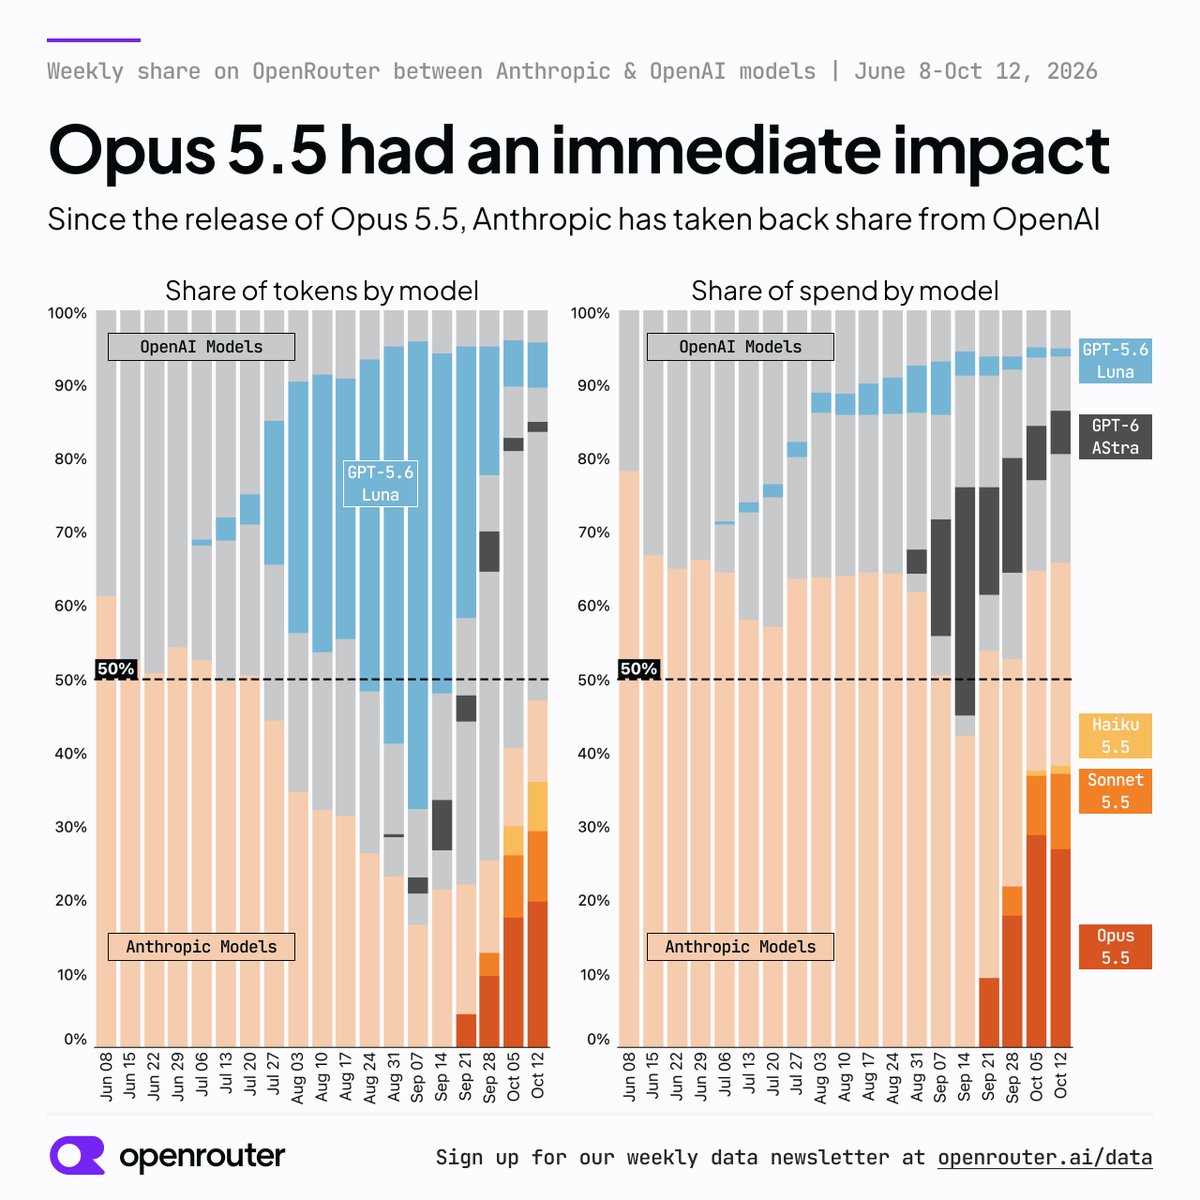
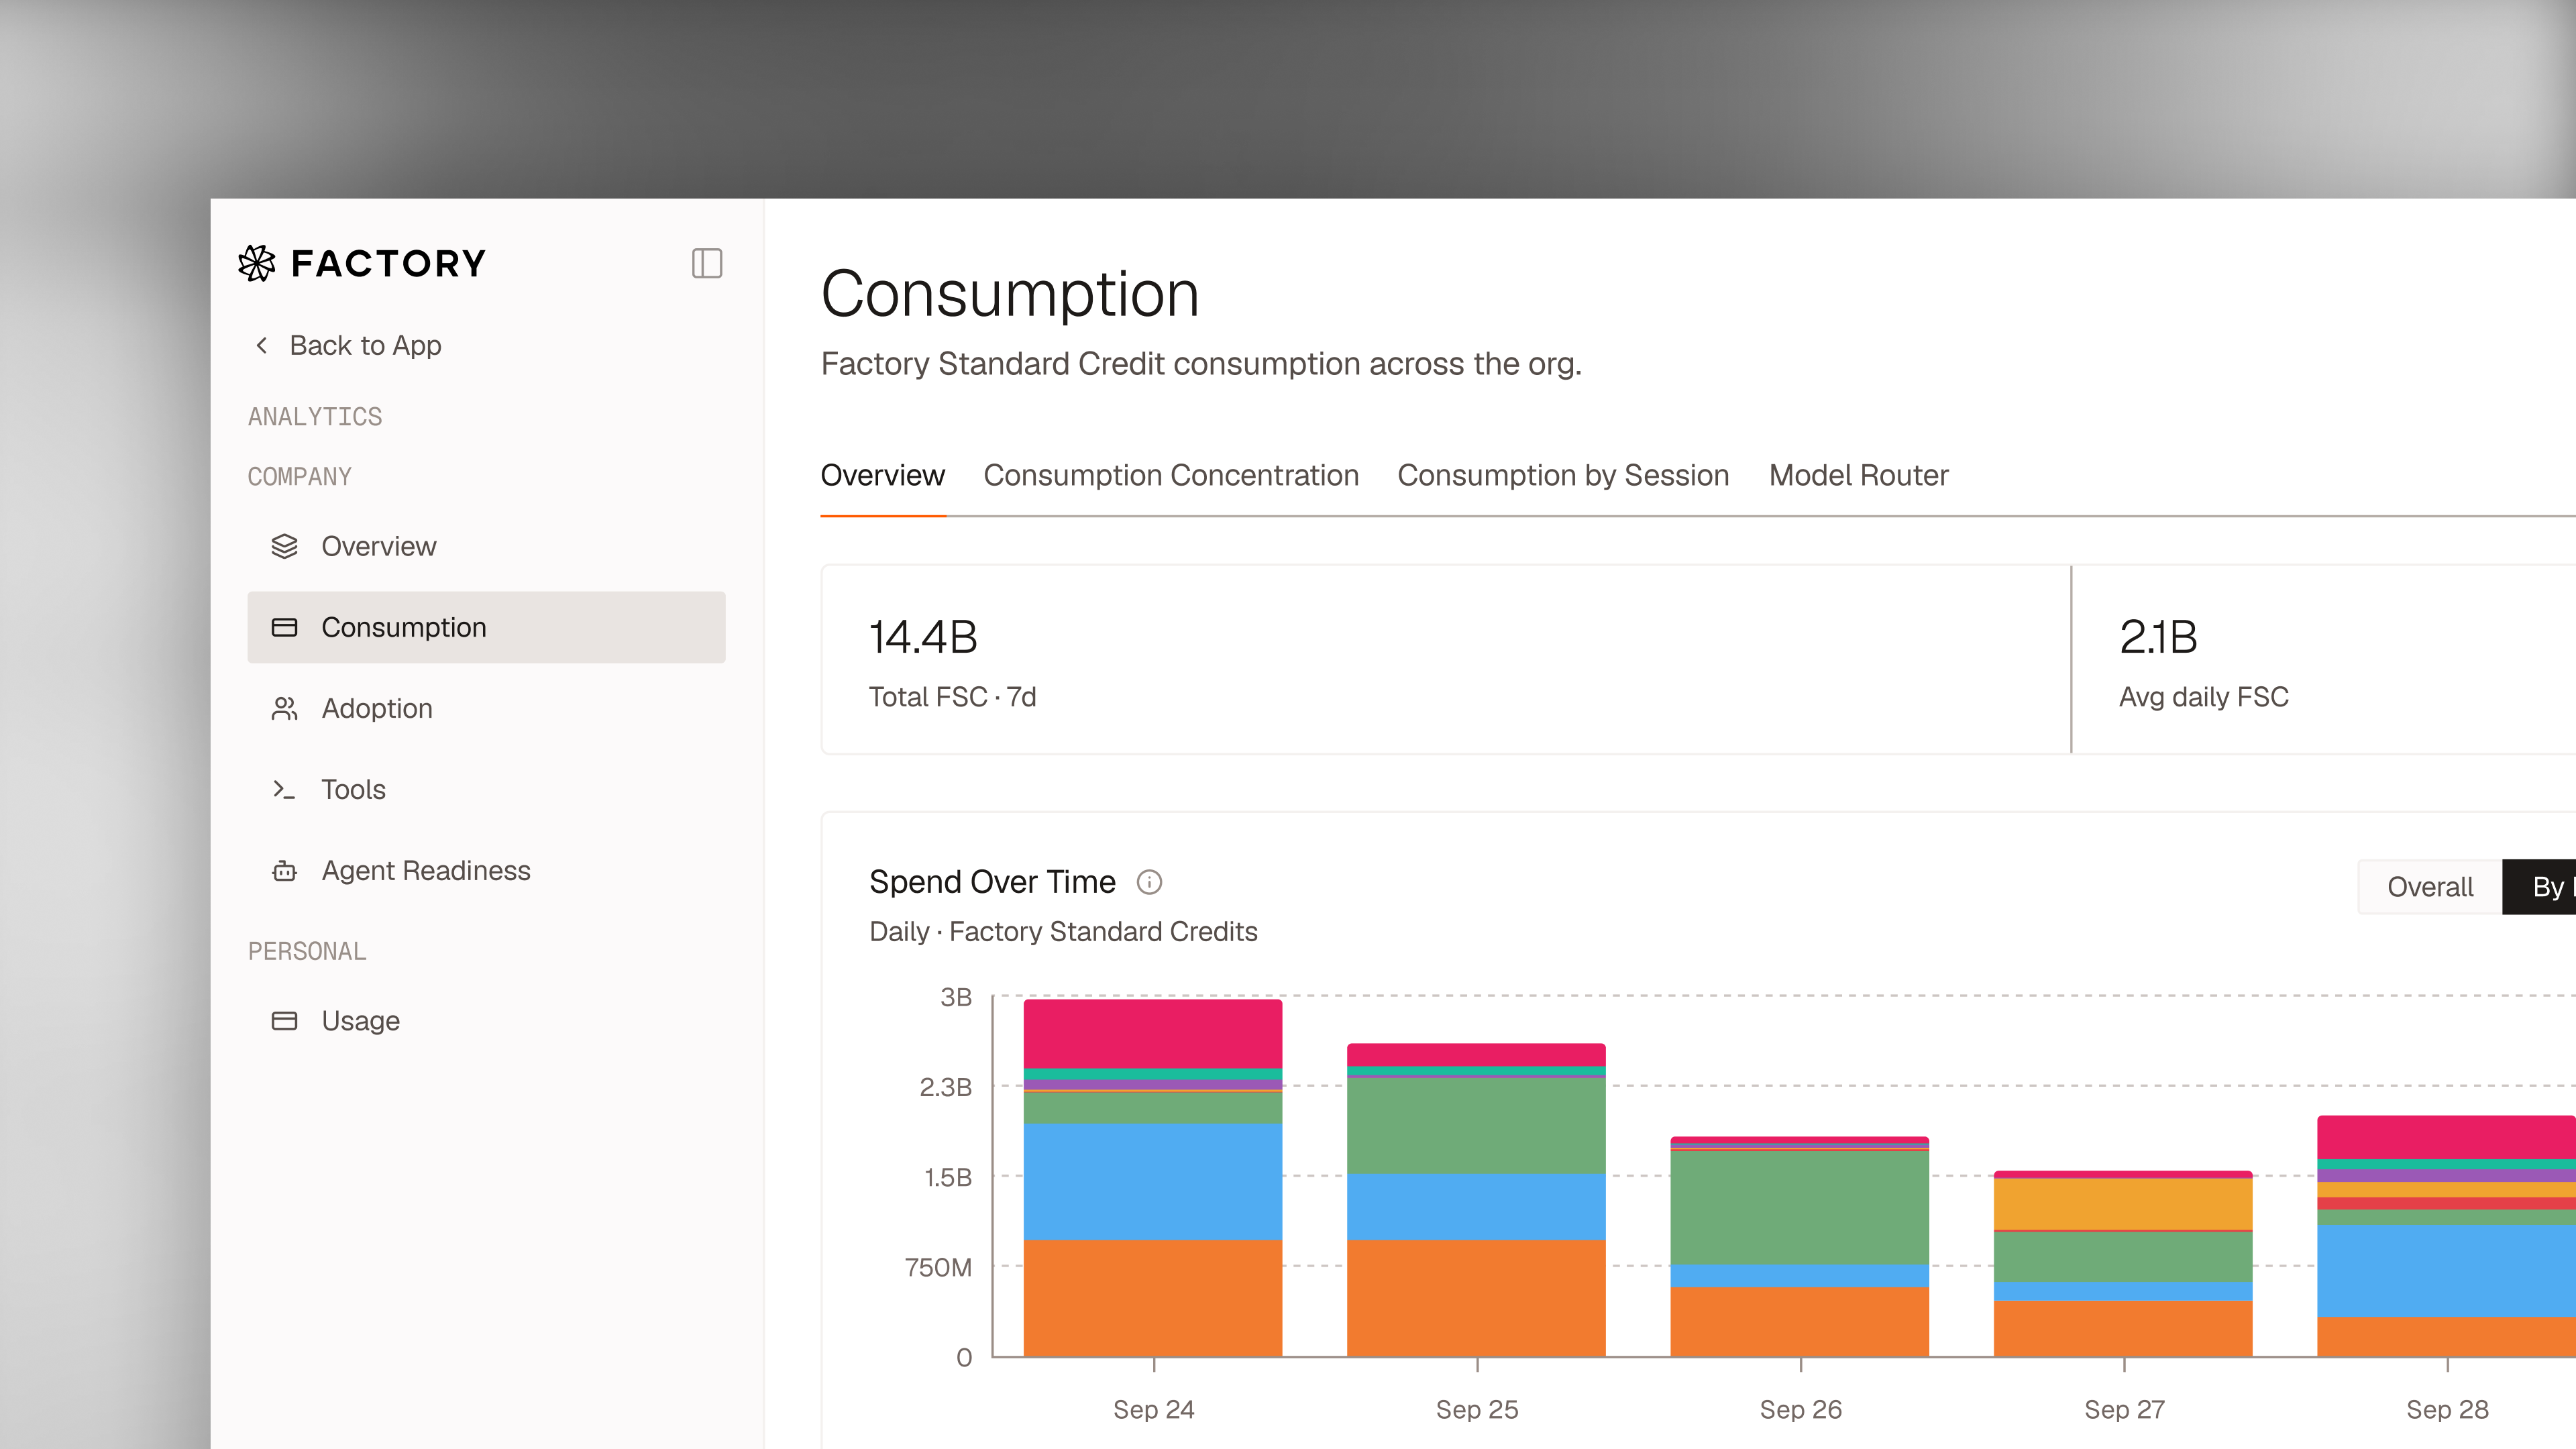
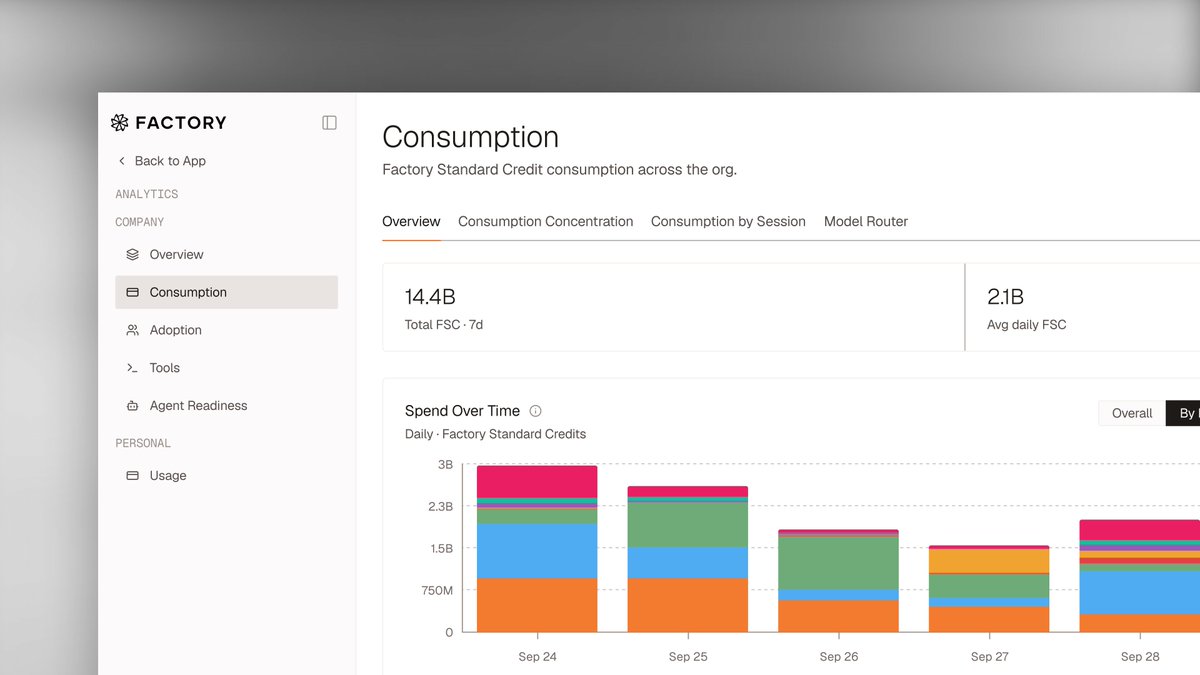
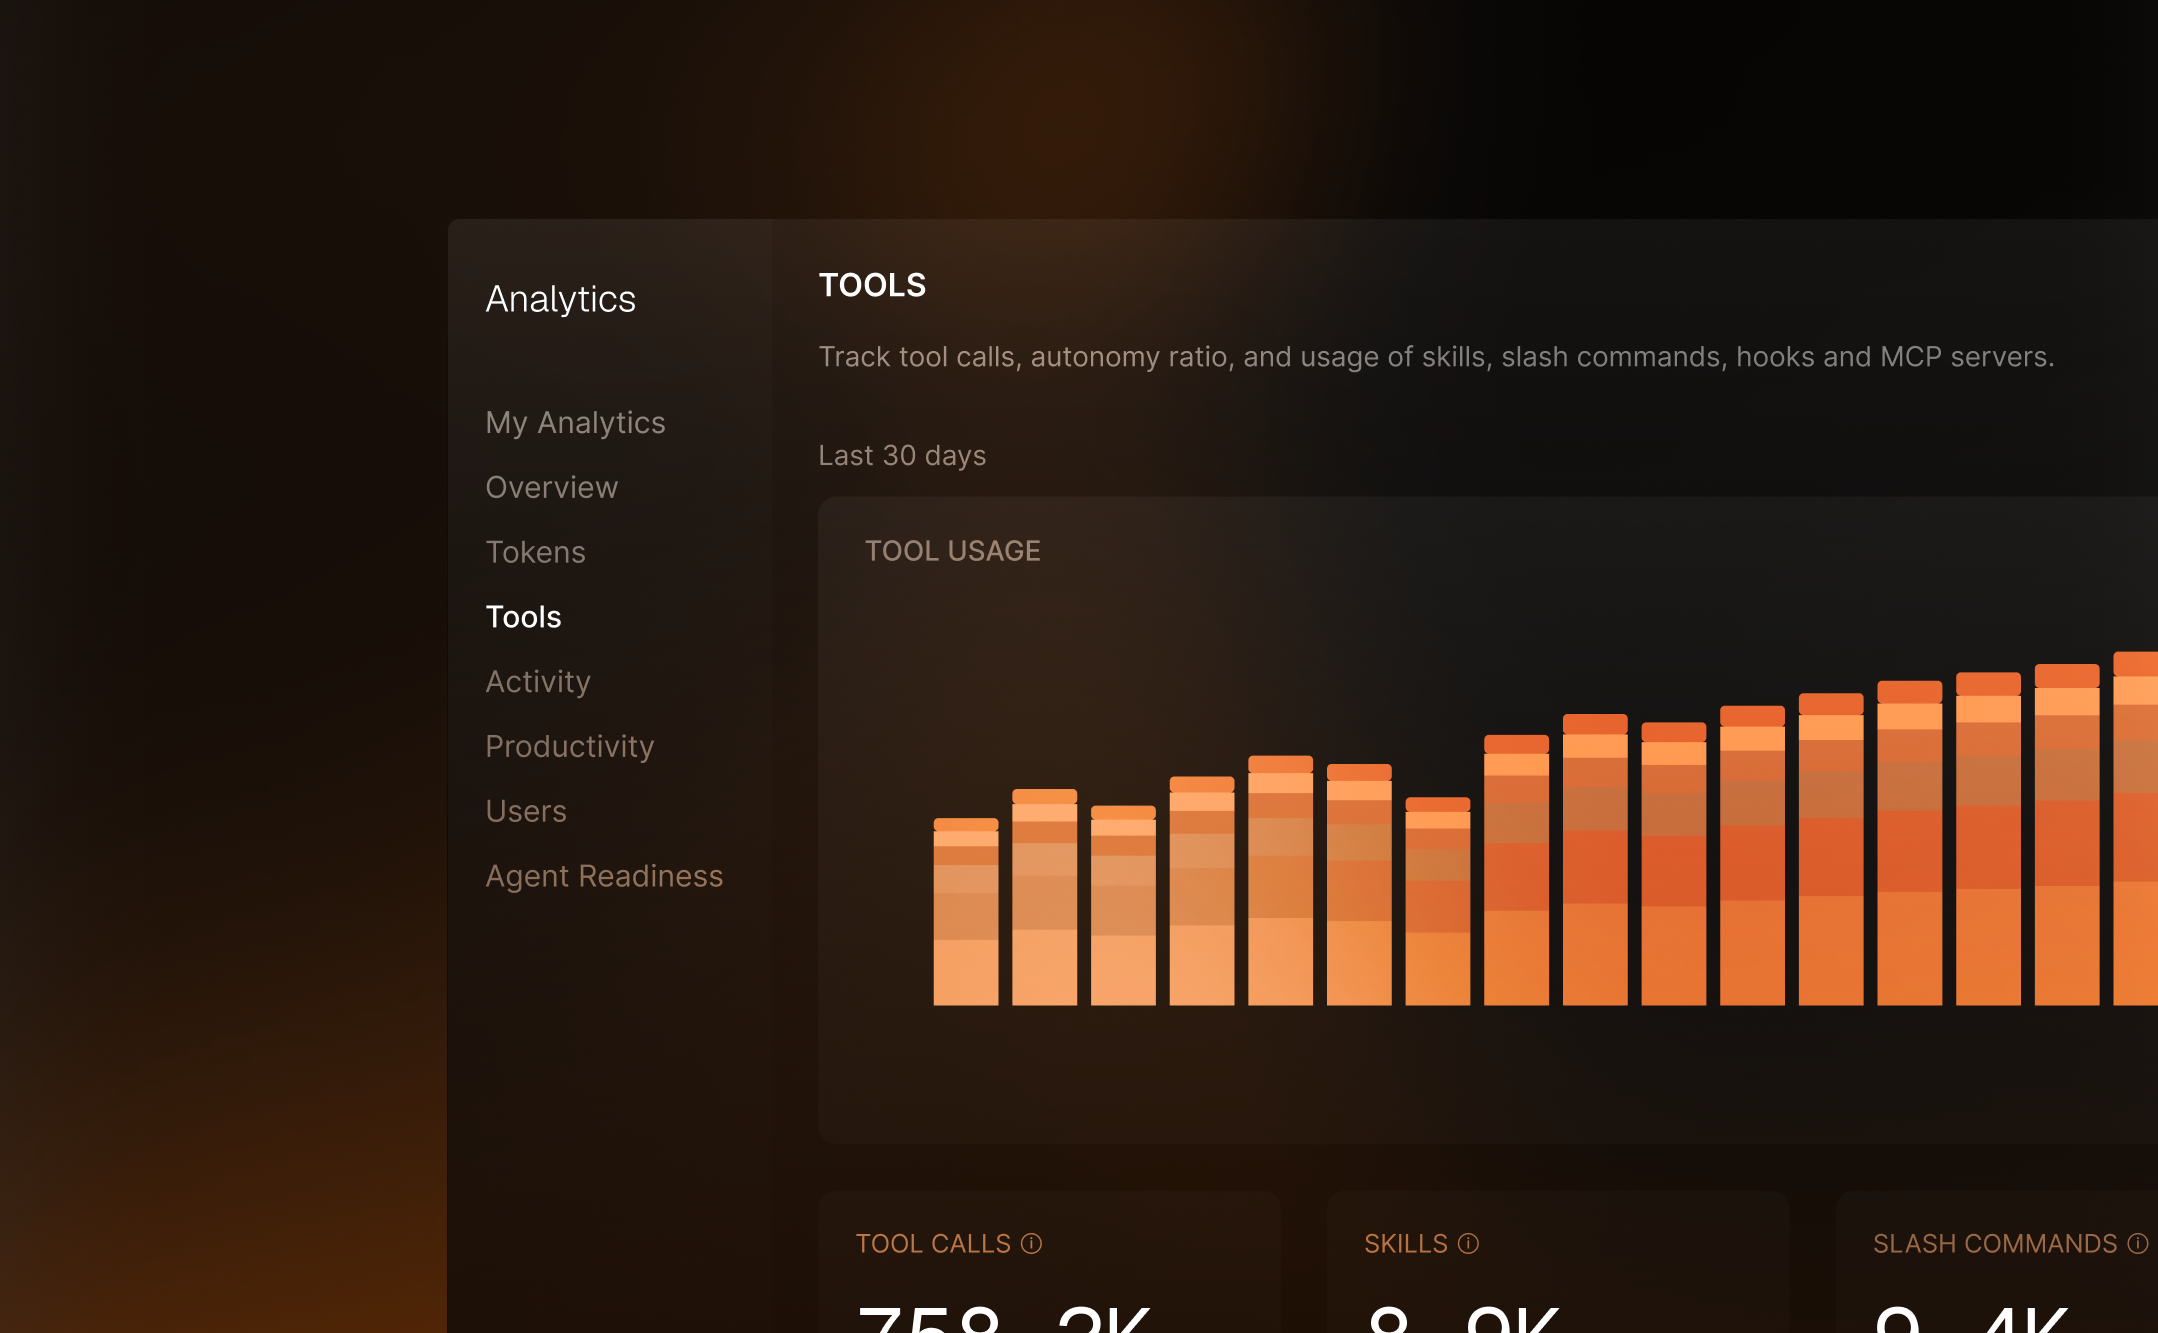
OpenRouter's Activity dashboard lets a team trace an AI spending spike from an aggregate chart to the individual requests behind it. Usage can be grouped by model, application, API key or workspace. Clicking a chart filters the request logs to that selection, where details show costs, the provider used and performance. The dashboard announcement describes this path from a billing question to the workload responsible.
Inspecting the actual conversation requires an additional condition: private input/output logging must have been enabled when the request ran. Turning it on afterward cannot recover past prompts. Per-message text-unit counts are estimates, while generation totals reflect recorded usage.
Terms in this piece · Glossary
token — The chunk of text a model reads and writes in — roughly three-quarters of a word — and the unit AI usage is billed in.