OpenRouter's analytics API opens per-agent and per-request spend data
- Source
- x.com
- Date

Big upgrade to the API powering the Activity dashboard. View and query your AI usage per agent, per model, and per request. Spend, tokens, cache hit rate, latency, and blended cost per token, with drill-down from any chart. Features 👇

Runaway agent monitoring: Trends sort the same data by movement instead of size. A panel ranks what's rising and falling across models, users, API keys, and apps, which makes it easy to spot a runaway agent or a new model gaining traction in your org.

Explore lets you assemble the view yourself: pick a metric (spend, tokens, cache hit rate, or latency down to P50/P90/P99), group by dimensions like model, app, user, or any classifier, and choose your rollup. Views can be saved for your or shared w your whole org.
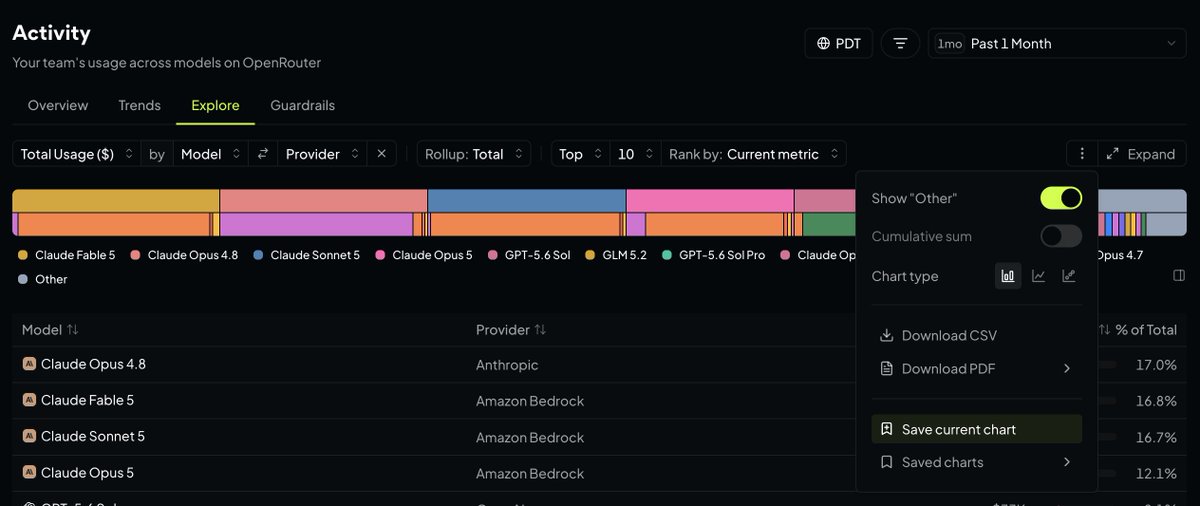
New: Upgraded Analytics API Everything in Explore is also available through the new Analytics API. Call /analytics/meta to see supported metrics and dimensions, then query:

Context
OpenRouter's expanded analytics API makes it possible to trace an AI bill back to the models and access keys generating it. The announcement describes querying usage by model, application or user and examining changes over time. In the company's own account, an -assisted review identified a preview model costing about $6,200 per month and attributed 98% of that spending to one batch-pipeline key. That example illustrates the purpose of the breakdown: locate a specific source of spending that a total bill would conceal. The reported figure describes the identified expense, not measured savings after the model was changed.
- AI agent — An AI system that doesn't just answer once but works toward a goal in a loop — taking actions, reading the results, and deciding what to do next.

Checking sign-in…
Loading comments…